Why This Website is One Megabyte Per Page
25 Nov 2019

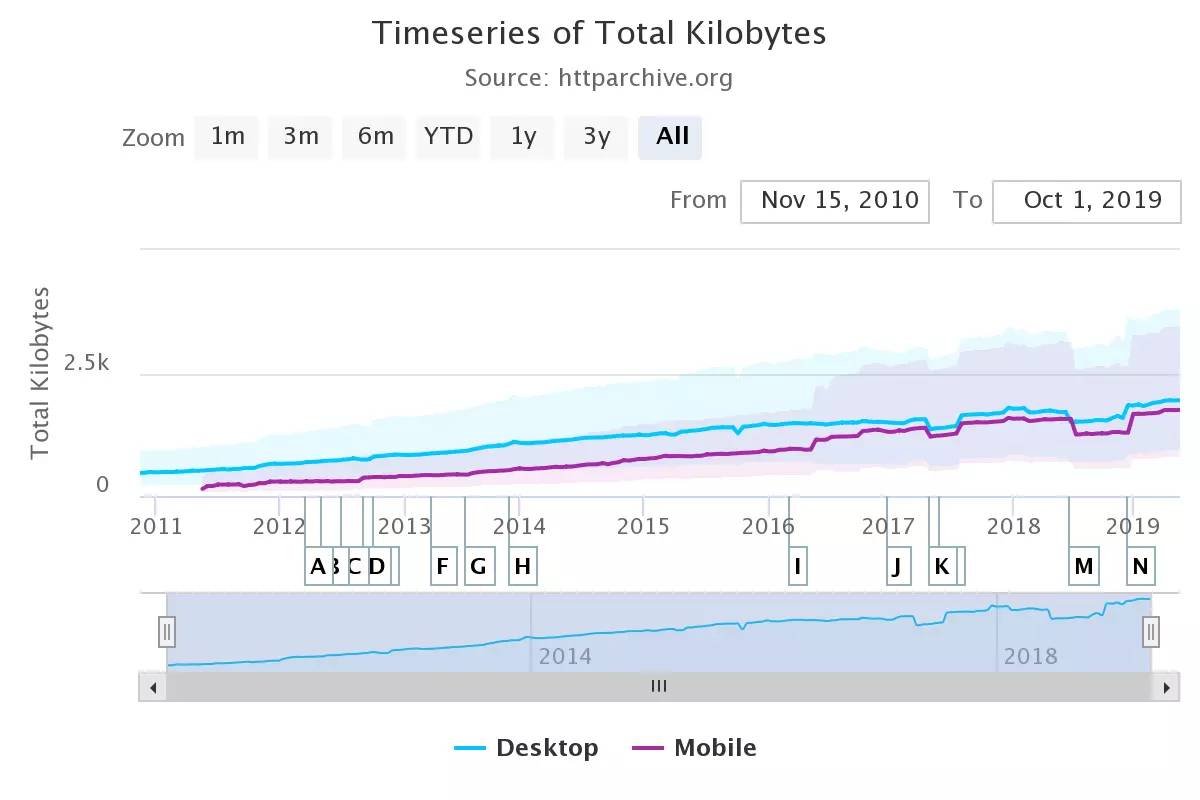
Plot showing the increase in the size of mobile and desktop web pages. The medians are in the solid lines, with the shaded regions showing the distribution of results.1
Each and every page of this website strives to be less than 1 MB in size. This is a conscious design decision in a bid to lower the energy consumption of the computers used to serve and display it.
How much energy is used to display a web page?
The energy consumed by a website is a combination of the energy used to serve the site, transmit it to the client, and render the page on the client machine. The rise of cloud computing makes it easy to forget that web servers are, in fact, physical computers. The energy consumption of a server depends in part on the load on the server, though with modern boost algorithms and power saving modes, estimation of the power consumption for a given website becomes significantly more difficult2. This becomes even more complex as websites often share the same server through virtualization. However, there are a number of factors which can be thought of as positively correlated with server power consumption, such as usage of CPU instructions, memory accesses, and hard drive accesses3.
The usage of CPU instructions depends strongly on the requests made by the client, and whether the website in question is static or dynamic. A static website consists of fixed pages, and the files associated are sent back to the client when requested. A dynamic website is usually backed by a database of information, and a client request corresponds to a database query. The information returned by that query is then used to construct the page that the client receives. As the process of serving a page dynamically is much more complex, it uses more CPU instructions, and depending on the page requested, will also require memory and disk accesses. This contributes to a higher level of power consumption. Pages that are larger in size or more complex, like those with images or video, also require more frequent disk usage. These factors must be managed to produce a low energy web page.
The transmission of data from the server to the client is also an energy intensive process. Key factors include the transmission technology used, such as fiber or Wi-Fi, the total transmission distance, and the power efficiency of the routers and switches along the way. Depending on the number of data centers with copies of the data around the world, and the number of requests for the information, the average power consumption from transmission alone can vary from tens to thousands of watts4. On the consumer end, wireless technologies such as Wi-Fi and mobile data are by far the most energy intensive. Wired connections are somewhat better, with optical fiber connections using the least energy.
On the client side, similar factors exist to those that influence power consumption for the server, with the exception of disk access being a non-issue. Measured from a panel of 500 popular sites in 2014, the average power consumption was found to be 50.1 mWh per page visit5. Given that the median web page has increased in size by 64.6% on desktop and an incredible 178.4% on mobile1, power consumption has likely remained constant if not increased despite improvements in computing efficiency.
The overall power consumption of a website is complex, and combining all factors together of server processing, transmission, and client processing can be difficult. However, a 2012 assessment estimated that a gigabyte of data transferred over the internet is directly responsible for approximately 5.13 kWh of energy6. Using a United States electrical grid average of 0.45 kg CO2 per kWh7, this means that a single gigabyte of data causes 2.3 kg of CO2 emissions.
The estimates discussed so far neglect the life cycle costs associated with the manufacture and disposal of the hardware. A 2004 life cycle analysis of personal desktop computers8 found that large portions of the total impact of a personal computer occur outside of the usage phase of a computers life. Depending on the type of environmental impact, the usage phase could be responsible for very little, with only 10% or so of greenhouse gas emissions occurring in the usage phase. There are some caveats, as the analysis is rather old, and the analysis does assume lower usage time per week than what might be typical for computers in the office or home today. Additionally, the analysis considers Korean manufacturers distributing computers within Korea, while for other nations the devices may be shipped by boat or air, potentially significantly increasing the impact of the distribution phase. These life cycle costs are still a consideration in web design; a more complex website generally uses more RAM5, leading users and server operators to replace their devices more often and incur more costs associated with the production and disposal phases of the life cycle.
How does Fragile Little World reduce its footprint?
Fragile Little World makes use of several techniques to reduce the amount of data and number of requests needed to render a page, saving energy throughout the process of serving, transmitting, and rendering. The first is the decision to use a static website. As discussed previously, static sites require no server side processing. In order to simplify the creation of multiple pages, I use a static site generator9, which takes in files in a simplified format, such as markdown, and uses templates to create the final pages. This makes writing a new article as simple as editing a text file, so long as everything else is set up correctly.
The site also does not use any Javascript for client side scripting, nor does it have analytics or advertisements. This, combined with a static site, does mean that there are certain things that are simply not possible. I have no idea if anyone visits the site, or how they found it. I cannot have comments on articles, since there is no processing. And, most important for many websites, I cannot make money off of advertisements. At the moment, this is no problem, as Fragile Little World is a hobby project and does not cost me anything. But for many site owners, this is a deal breaker. Sites in this situation often turn to merchandise sales, affiliate links for products they may discuss, or a monthly contribution service like Patreon. Though the sites that run these services may not follow the same eco-design focus, users will not visit them as often as the main website. Despite the availability of these alternatives, the compromises involved force many webmasters to stick with dynamically processed pages with complex scripts.
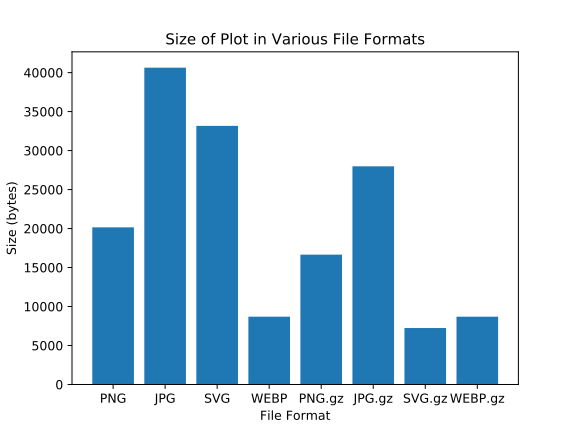
Just because a website needs dynamic processing does not mean there is no way to reduce the impact of the page. Some of the most data intensive aspects of modern web pages are images and video. Video is extremely data intensive, and though modern compression and streaming can alleviate this issue somewhat, there is no getting around that video is a huge amount of data. As an example, I previously did a project in Kerbal Space Program, about which I made a video10. The video is over 200 MB in size after compression, while the script for the voice overs and the source code are less than a MB completely uncompressed. Even with a few illustrative images, the same content could be had with far less energy usage. As a result, I have chosen to move away from video on Fragile Little World. Images are much more manageable however, as illustrated in the chart below.

Plot showing its own size in various file formats with and without compression. Generated using a small Python script11.
JPEG and PNG image formats are among the most common on the internet, as they have enjoyed broad and long time support from browsers. However, as you can see, they are not great at compressing the graph. PNG beats JPEG on this kind of content because its lossless compression is design for graphics like plots, while JPEG is aimed at photographs where it does somewhat better. WEBP is a newer image format developed from the intraframe compression algorithms from the VP8 video compression standard12. SVG does not seem to compete with WEBP on the face, especially as it has gained browser integration only recently despite being a much older format. However, SVG offers some key advantages here that should be addressed:
- SVG is a vector file format, meaning it can be scaled up and down to the target screen size with no loss in fidelity, and no wasted data on small screens.
- SVG is a native output from vector editing software, as well as from tools for generating plots, like matplotlib used here.
- Since SVG is a vector format, it is more like a text file with instructions for recreating the image, rather than an array of pixels. This means it can be aggressively compressed with standard text compression algorithms down to a smaller size than WEBP, for images like charts and clipart. For photos or images that don’t have native vector representations, WEBP will perform better, like on the chart of web page size at the beginning of this article.
These factors inform the mix of images presented here. Photos or images without native vector representations are shown as WEBP, while images like the logo or plots created to illustrate a point are served in SVG. This takes full advantage of compressing the website as a whole, not only reducing the size of HTML and CSS but also the included SVG images. These techniques, combined with using images sparingly, helps to reduce the footprint of the site overall.
There is one more notable technique used on Fragile Little World to reduce the size of the pages, which is the use of local fonts. Many web pages will send the user a particular font that they want the page to be rendered in. Depending on how thoroughly the font is trimmed to only the characters used, and how much content is on the page, the font set can actually be larger than the content! Sticking with whatever is the browser default san serif font is a good way for Fragile Little World to squeeze the most out of every kilobyte, though it does mean different browsers will render the text differently.
With all these factors together, this web page is only 96 KB, before compression and without any caching. After compression, it drops to a tiny 50 KB, despite having quite a bit of content. This means it is only responsible for approximately 115 g of CO2.
References and Footnotes
-
Boukema, A. (2017). Calculating the Energy Consumption of a Website (Masters Thesis). Retrieved from https://www.os3.nl/_media/2016-2017/courses/rp2/p58_report.pdf ↩
-
Bartalos P., Blake M.B. (2012) Engineering Energy-Aware Web Services toward Dynamically-Green Computing. In: Pallis G. et al. (eds) Service-Oriented Computing - ICSOC 2011 Workshops. ICSOC 2011. Lecture Notes in Computer Science, vol 7221. Springer, Berlin, Heidelberg ↩
-
Hinton, K., Baliga, J., Feng, M., Ayre, R., Tucker, R. S., (2011) Power Consumption and Energy Efficiency in the Internet. IEEE Network, March/April 2011 ↩
-
Philippot, O., Alain, A., Leoucq, T. (2014) Characterization of the Energy Consumption of Websites. In: 2nd International Conference on ICT for Sustainability. ↩ ↩2
-
Costenaro, D, Duer, A., (2012) The Megawatts behind Your Megabytes: Going from Data-Center to Desktop. In: ACEEE Summer Study on Energy Efficiency in Buildings. ↩
-
Choi, BC., Shin, HS., Lee, SY. et al. International Journal of Life Cycle Assessment (2006) 11: 122. https://doi.org/10.1065/lca2004.12.196 ↩
Have questions or looking to discuss this article? Email contact@fragilelittle.world.
